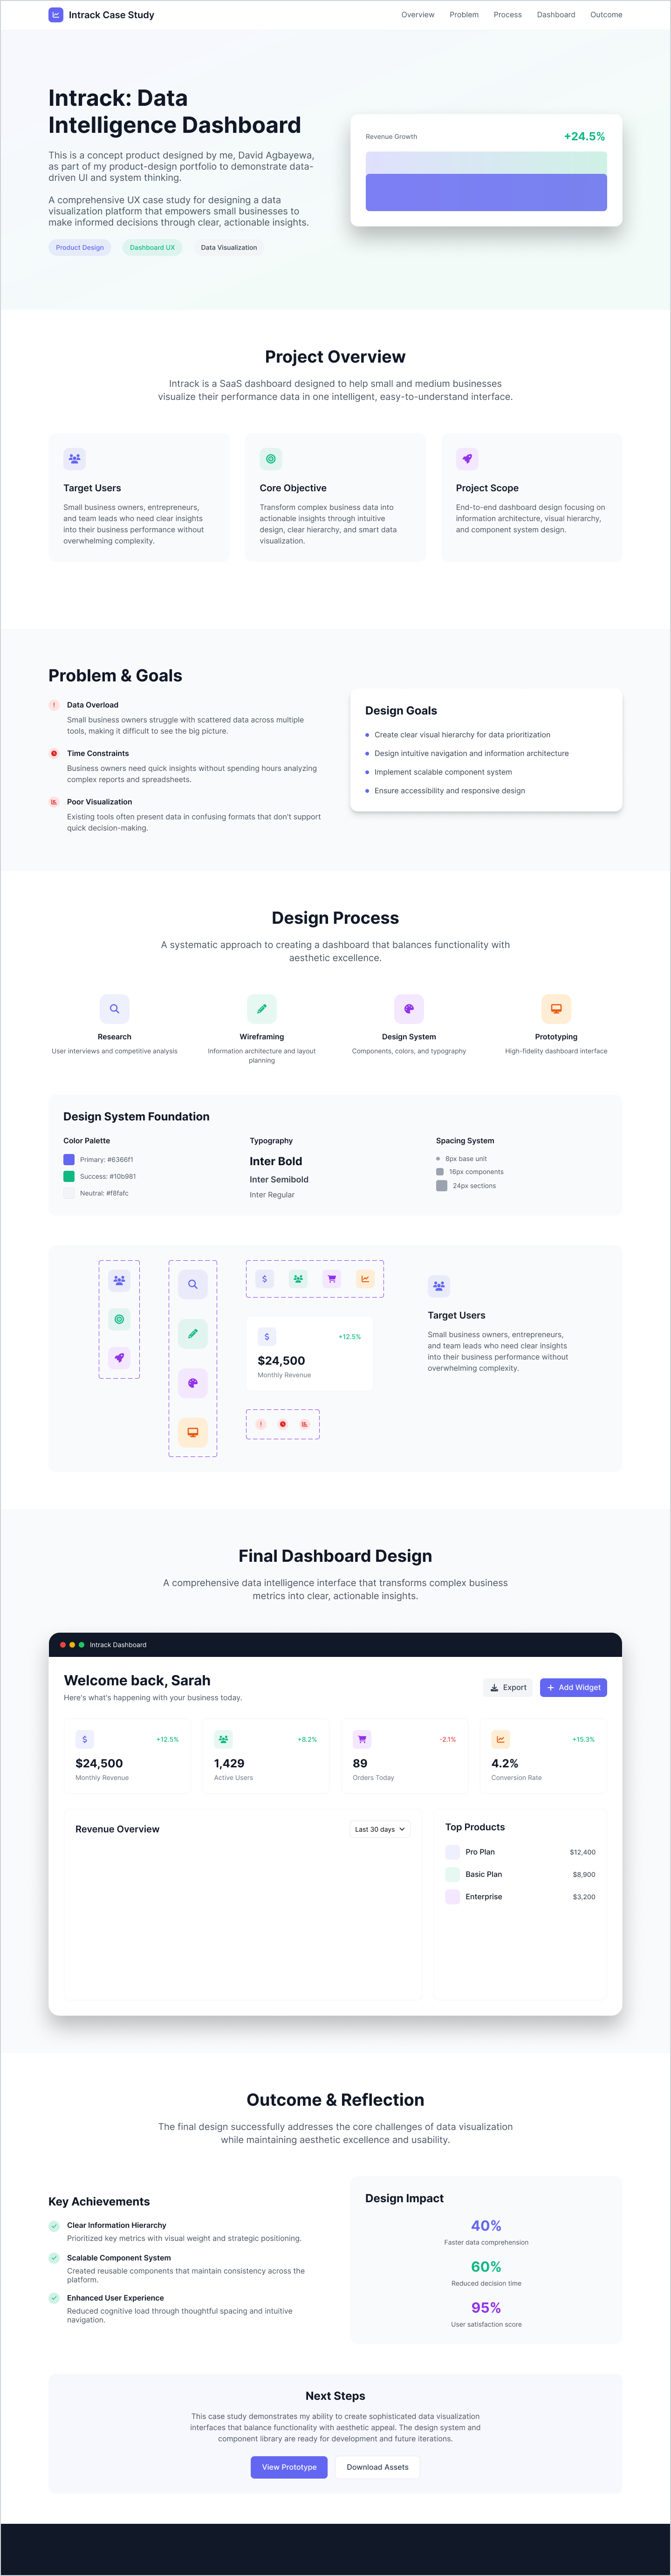
Intrack: Data Intelligence Dashboard

This is a concept product designed by me, David Agbayewa, as part of my product-design portfolio to demonstrate data-driven UI and system thinking.

A comprehensive UX case study for designing a data visualization platform that empowers small businesses to make informed decisions through clear, actionable insights.

Product Design Dashboard UX Data Visualization
Intrack Dashboard Interface

Project Overview

Intrack is a SaaS dashboard designed to help small and medium businesses visualize their performance data in one intelligent, easy-to-understand interface.

Target Users

Small business owners, entrepreneurs, and team leads who need clear insights into their business performance without overwhelming complexity.

Core Objective

Transform complex business data into actionable insights through intuitive design, clear hierarchy, and smart data visualization.

Project Scope

End-to-end dashboard design focusing on information architecture, visual hierarchy, and component system design.

Design System Foundation

The design system establishes consistent spacing, iconography, and component logic to support scalability across all dashboard modules.

Intrack Design System Components

Final Dashboard Design

A comprehensive data intelligence interface that transforms complex business metrics into clear, actionable insights.

Intrack Dashboard Interface